The above is also the title of a paper I presented at the INWWCT at NTNU last Monday. The paper presents a graph-based method for document representation. It was exciting to be able to present the work, which was part my MSc Thesis.
While the paper of course is available for anyone to read, this post serves as a (rather long) TL;DR -- a summary and cursory introduction to the topic. I'll briefly explain the problem of text classification, our motivation for exploring better representations, and our method.
The post is crafted from my manuscript from the paper presentation.
The problem of text classification is that of assigning a textual document to one or more categories, based on the contents of the document.
To make the computer classify our documents, we need two things: 1) a classifier, and 2) a representation of the documents that the classifier understands and can reason with. There exists a host of classification algorithms, both specialized for text and more general.
A common representation, used by many of these, are feature-vectors. A feature-vector representing a document is typically a vector where each element represents a single term, and the value of this element indicates how important the term is with regard to the contents of the document.
Different ways to measure these importances exist, but the most common are Term Frequency (TF) and Term Frequency-Inverse Document Frequency (TF-IDF). The TF is simply the relative frequency of each term within the document. TF-IDF calculated as the TF multiplied by the inverse of the Document Frequency -- the fraction of the documents which contain that particular term.
TF and TF-IDF are both examples of what we call bag-of-words models. This is because they represent documents as a sets of terms, without any attention to their order. Thus, two documents are represented the exact same way if they contain the same words with the same frequencies. Consider, for example, the two small sentences “a man bit the dog” and “the dog bit a man”. Although the meaning of the two are very distinct indeed, they have the same representation under any bag-of-words model.
Since the relationships between terms obviously are important, we wanted to try to create a representation that captured some of this information. And, since graphs are a natural choice for representing relations, we decided on a graph-based approach to the problem. Our goal was to find a better way to determine the importance of terms within documents, based on their interrelations interpreted as a graph structure.
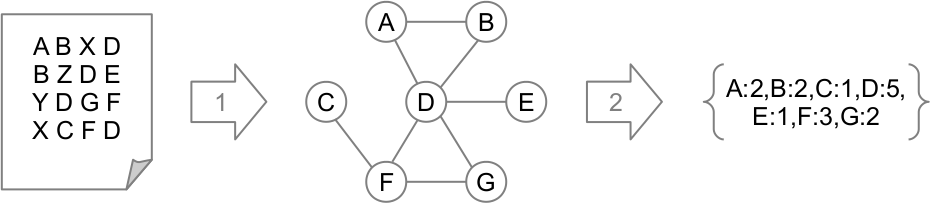
The following figure roughly explains the idea. The document is turned into a graph representation, and the importance of each term decided from their position within this graph. Once determined, the term importances can be extracted as a feature-vector like any created using TF-IDF, although hopefully with more appropriate importance values.
The first step of the process is to convert the documents to graphs. Terms are a natural choice for the nodes. They key is of course how to define what constitutes a relationship, or edge, between two terms.
We studied two types of term relationships, each its own network type: term co-occurrences and dependencies.
In the co-occurrence networks, we connect two terms, or nodes, if they occur within the same textual context. A textual context is some specified part of the document, which means we basically link terms if they occur close together in the text.
Of the many possible definitions of contexts, we experimented with sentences and n-word windows. While sentences should be self explanatory -- two terms are connected if they occur within the same sentence anywhere in the document. The n-word windows, on the other hand, are sequences of n consecutive terms. Thus, any terms occurring less than n words apart are co-occurring and linked in the network.
After some experimentation, we found that representations using sentences performed better for text classification, and stuck with these in our final representation.
Our second network type is based on semantic dependencies between terms. We used the Stanford Lexical Parser to extract dependencies from the text, and used these to construct the graph representation.
The parser a single sentence as input, and produces a list of dependencies between terms from the sentence. The terms and these dependencies can be seen as a sub-graph of the overall dependency network representing the document. By merging dependency graphs constructed from each of the sentences, we constructed networks for the entire documents.
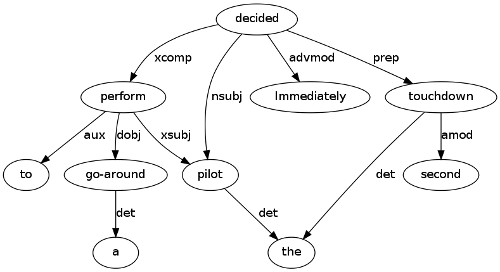
Below is an example of a dependency graph constructed from a random sentence from one of our corpora. Are you able to reconstruct the sentence from the graph? Even if you are not, the essence of the sentence should be obvious.
Once the document is constructed as a network, the next step is to evaluate the nodes to determine the importance of each term. To do this, we employ the concept of node centrality. The centrality of a node is a measure of how important it is compared to the other nodes in the network.
There exists a myriad of different node centrality measures. These can roughly be divided into four main categories as illustrated by the figure below.
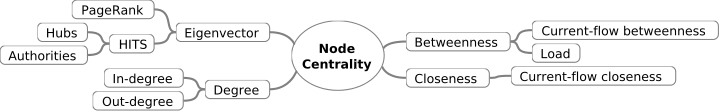
The simplest category is the degree-based centrality. These define node centrality in terms of the number and strengths of connections between a node and its neighbors.
The eigenvector centralities are also based on the node's neighbours, but is a bit more complex. These measures capture not only the number of neighbors a node has, but also take into account the importance of each neighbour. This group include among others, Google’s famous PageRank algorithm.
The groups of closeness and betweenness centrality measures are a bit different, in that they focus more on the overall network structure. Closeness centralities are defined in terms of the lengths of the shortest paths from a node to the rest of the nodes in the network. Betweenness centrality describes whether, and how frequently, a node is part of the shortest paths between pairs of other nodes in the network.
In an attempt to find a node centrality measure well suited for capturing term importance, we experimented with all the measures shown in the figure above. The figure below shows classification accuracies when using representations based on different centrality measures.
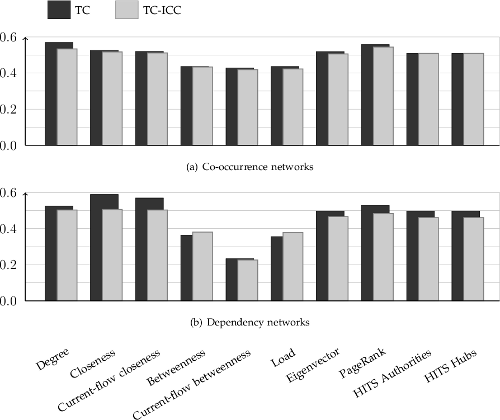
As we see, the same patterns repeat more or less for both network types, although the differences are most distinct for dependency-networks. The results indicate that degree centrality and PageRank may be best suited measures for co-occurrence networks, but closeness measures have the edge for dependency networks. It is also quite clear that the betweenness measures are the least suited for the task.
As you may have noticed, the above chart depicts two types of bars -- labeled TC and TC-ICC. These represent the two ways we tried to capture term importance based on node centrality. The first, Term Centrality (TC), is simply using the centrality of a term-node as an importance measure directly. The second, Term Centrality-Inverse Corpus Centrality (TC-ICC), is inspired by TF-IDF and uses information about the terms overall centrality in the rest of the corpus. TC-ICC is calculated as the TC value multiplied by the inverse of the term's Corpus Centrality (CC) -- that is, the node centrality of the term in a network constructed from the text of the entire document collection. Generally, TC performed better than TC-ICC in this experiment.
Lets briefly summarize the document representation, as outlined so far.
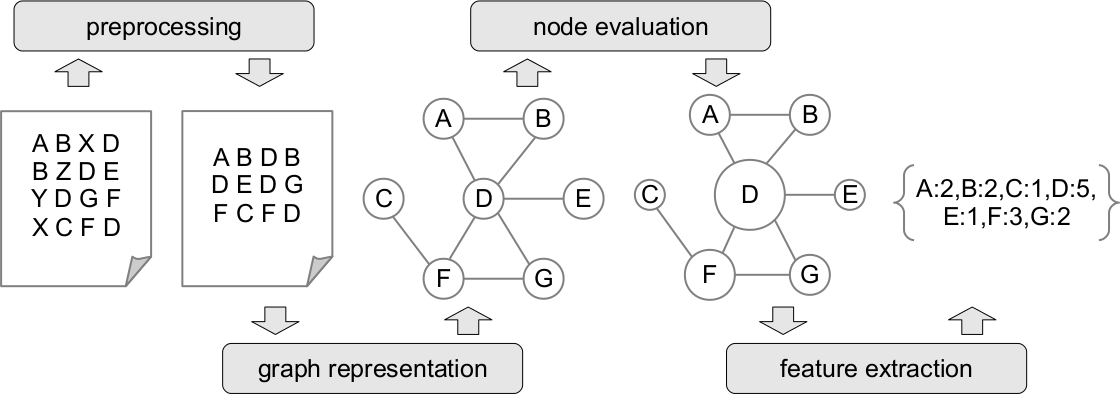
After some initial text preprocessing, a graph representation -- either a co-occurrence network or a dependency network -- is constructed for each document. The centrality of each node is then computed, using degree centrality for co-occurrence networks and closeness centrality for dependency networks. Based on the node centralities, the importance of each term is estimated as TC or TC-ICC. Finally, the TC or TC-ICC values are assembled into a feature-value vectors representing the documents.
Our initial series of experiments, including the node centrality measure evaluation described above, was designed to test various aspects of the representations. Instead of describing them all here, I'll summarize our findings. For the preprocessing, we found it best to do stemming and case-folding before constructing either network type. In addition, we ended up using stop-word removal for co-occurrence networks, but not for dependency networks. We also found that the edges should be undirected and unweighted for both network types.
In our final experiment, we compared the classification accuracy over two datasets using these graph-based representations, compared to that when TF and TF-IDF vectors were used. The results are summarized in the below table.
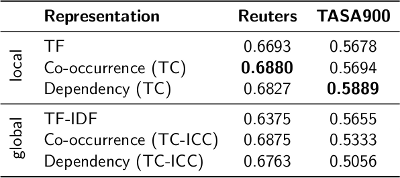
We found that the local measures, TF and TC, in most cases performed better than their global counterparts TF-IDF and TC-ICC. This is consistent with the results of the node centrality evaluation, where TC consistently performed slightly better than TC-ICC. That the local measures perform well, is in fact good news since these are less expensive to compute and do not need to be re-calculated every time a new documents is added to the document collection.
The second interesting observation from the results table is that graph-based representations scored better than the frequency-based measures TF and TF-IDF. We stress the fact that this of course only is a preliminary study. Our experiments only covered two datasets, after all. However, we believe these results to be an indication that this graph-based approach might have some merit, and perhaps be a way to improve document representations for text classification.
By the way, if you're still reading this, and is interested in more, my MSc thesis is also available. It discusses everything from this post and the paper, but focus on representations for texutal Case-Based Reasoning.